i am passionate about
machine learning
Scroll down to review some of my project highlights.
Scroll down to review some of my project highlights.


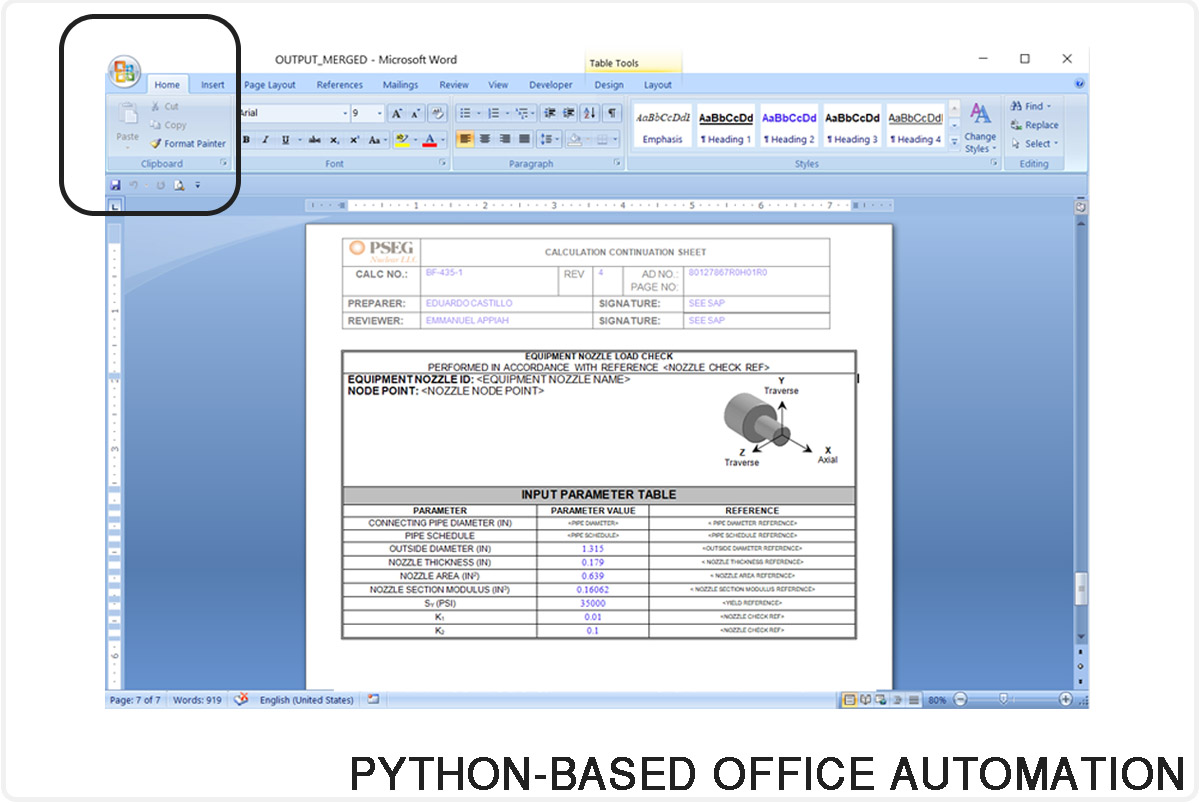
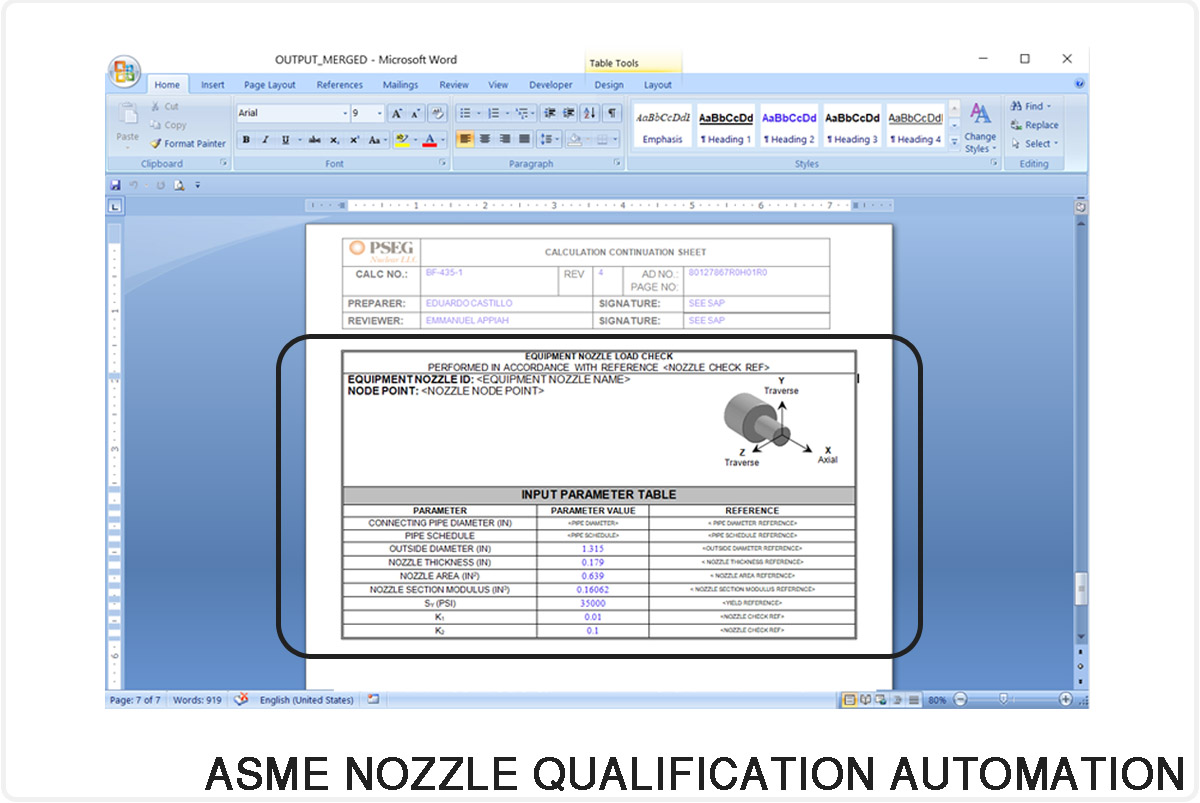
Using Python to collaborate more effectively.
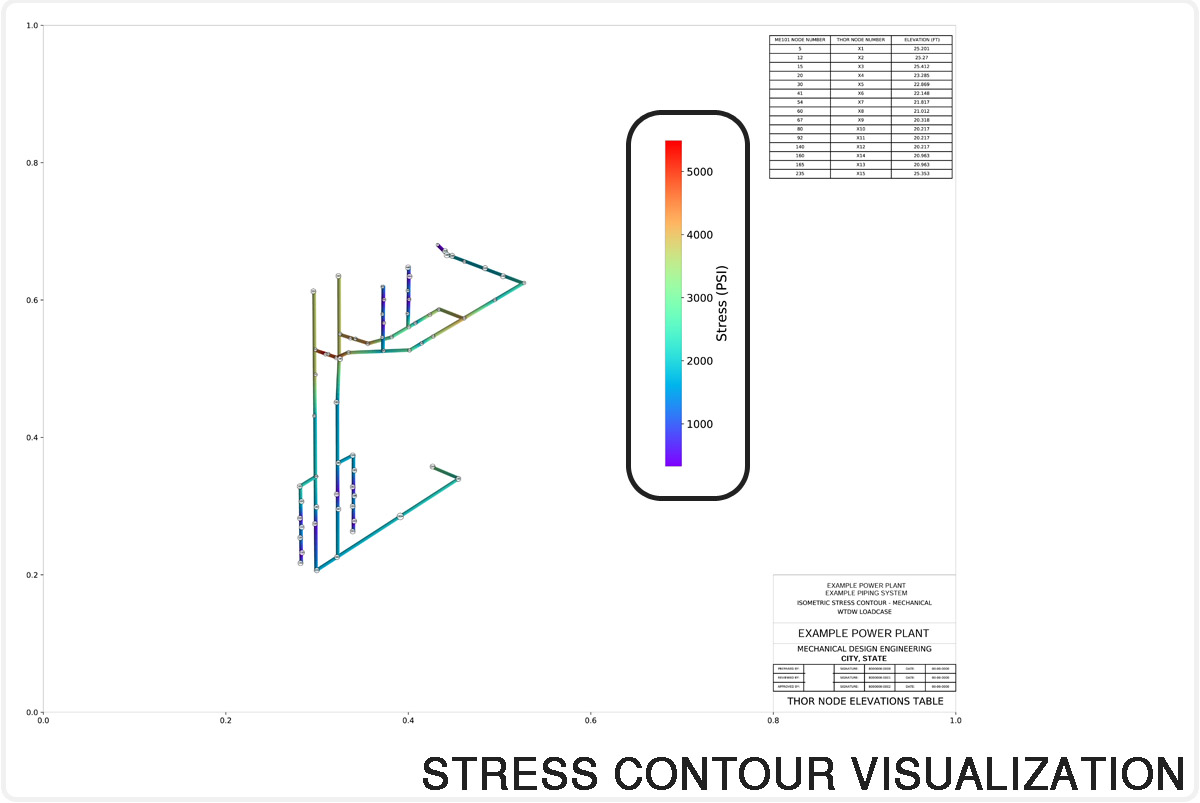
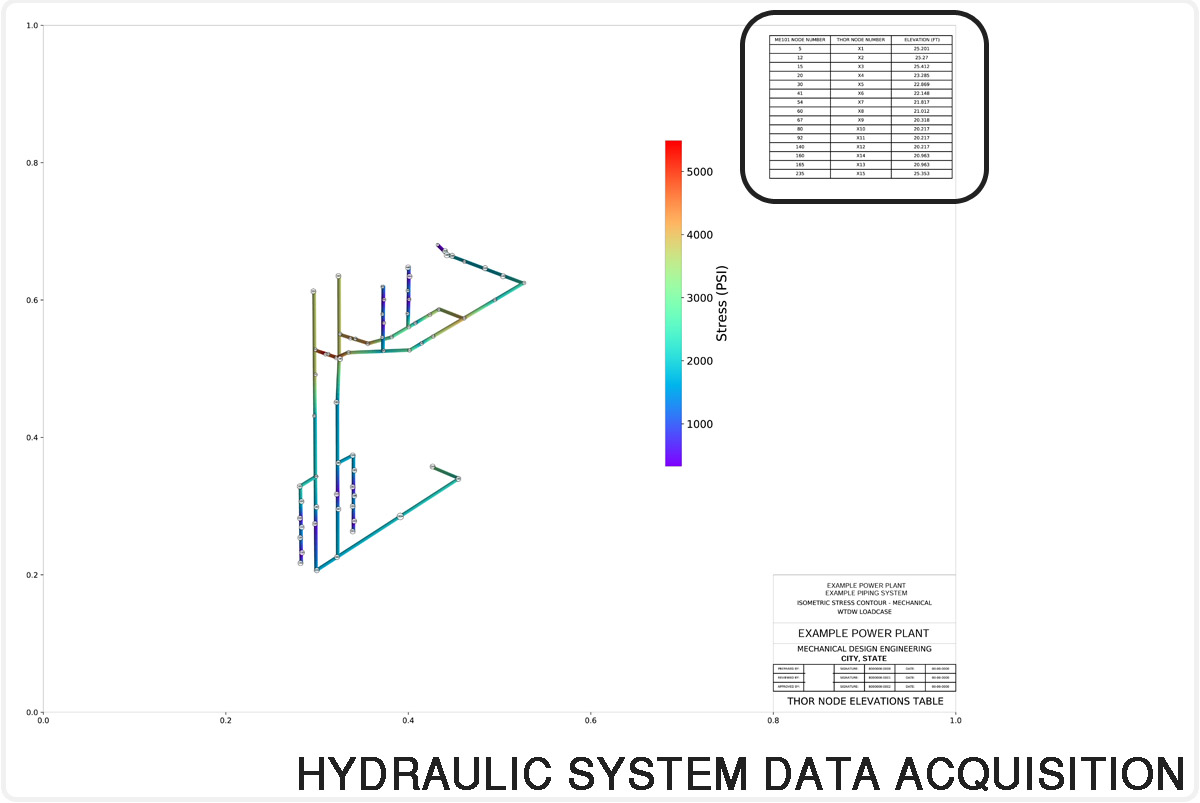
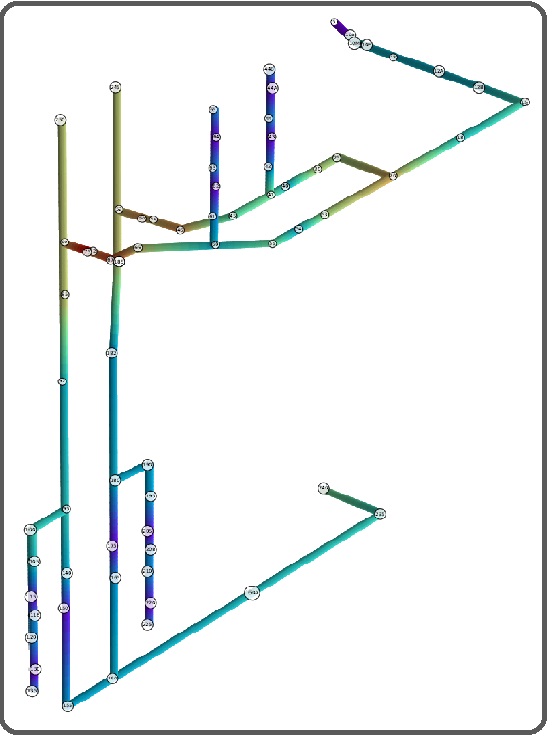
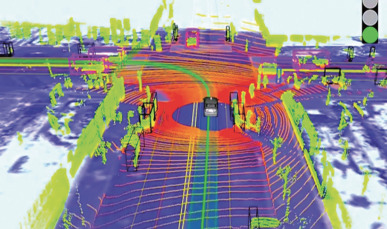
Programs like AFT Fathom don’t typically produce output that's easily relatable to the actual piping layout. NDAS addresses this problem by automatically mapping outputs from programs like Fathom and AutoPIPE onto a common 3D representation.
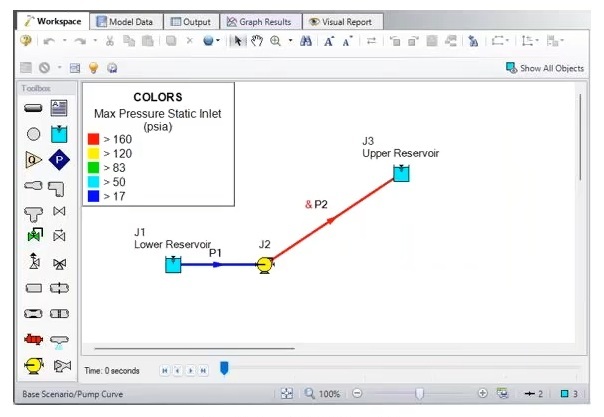
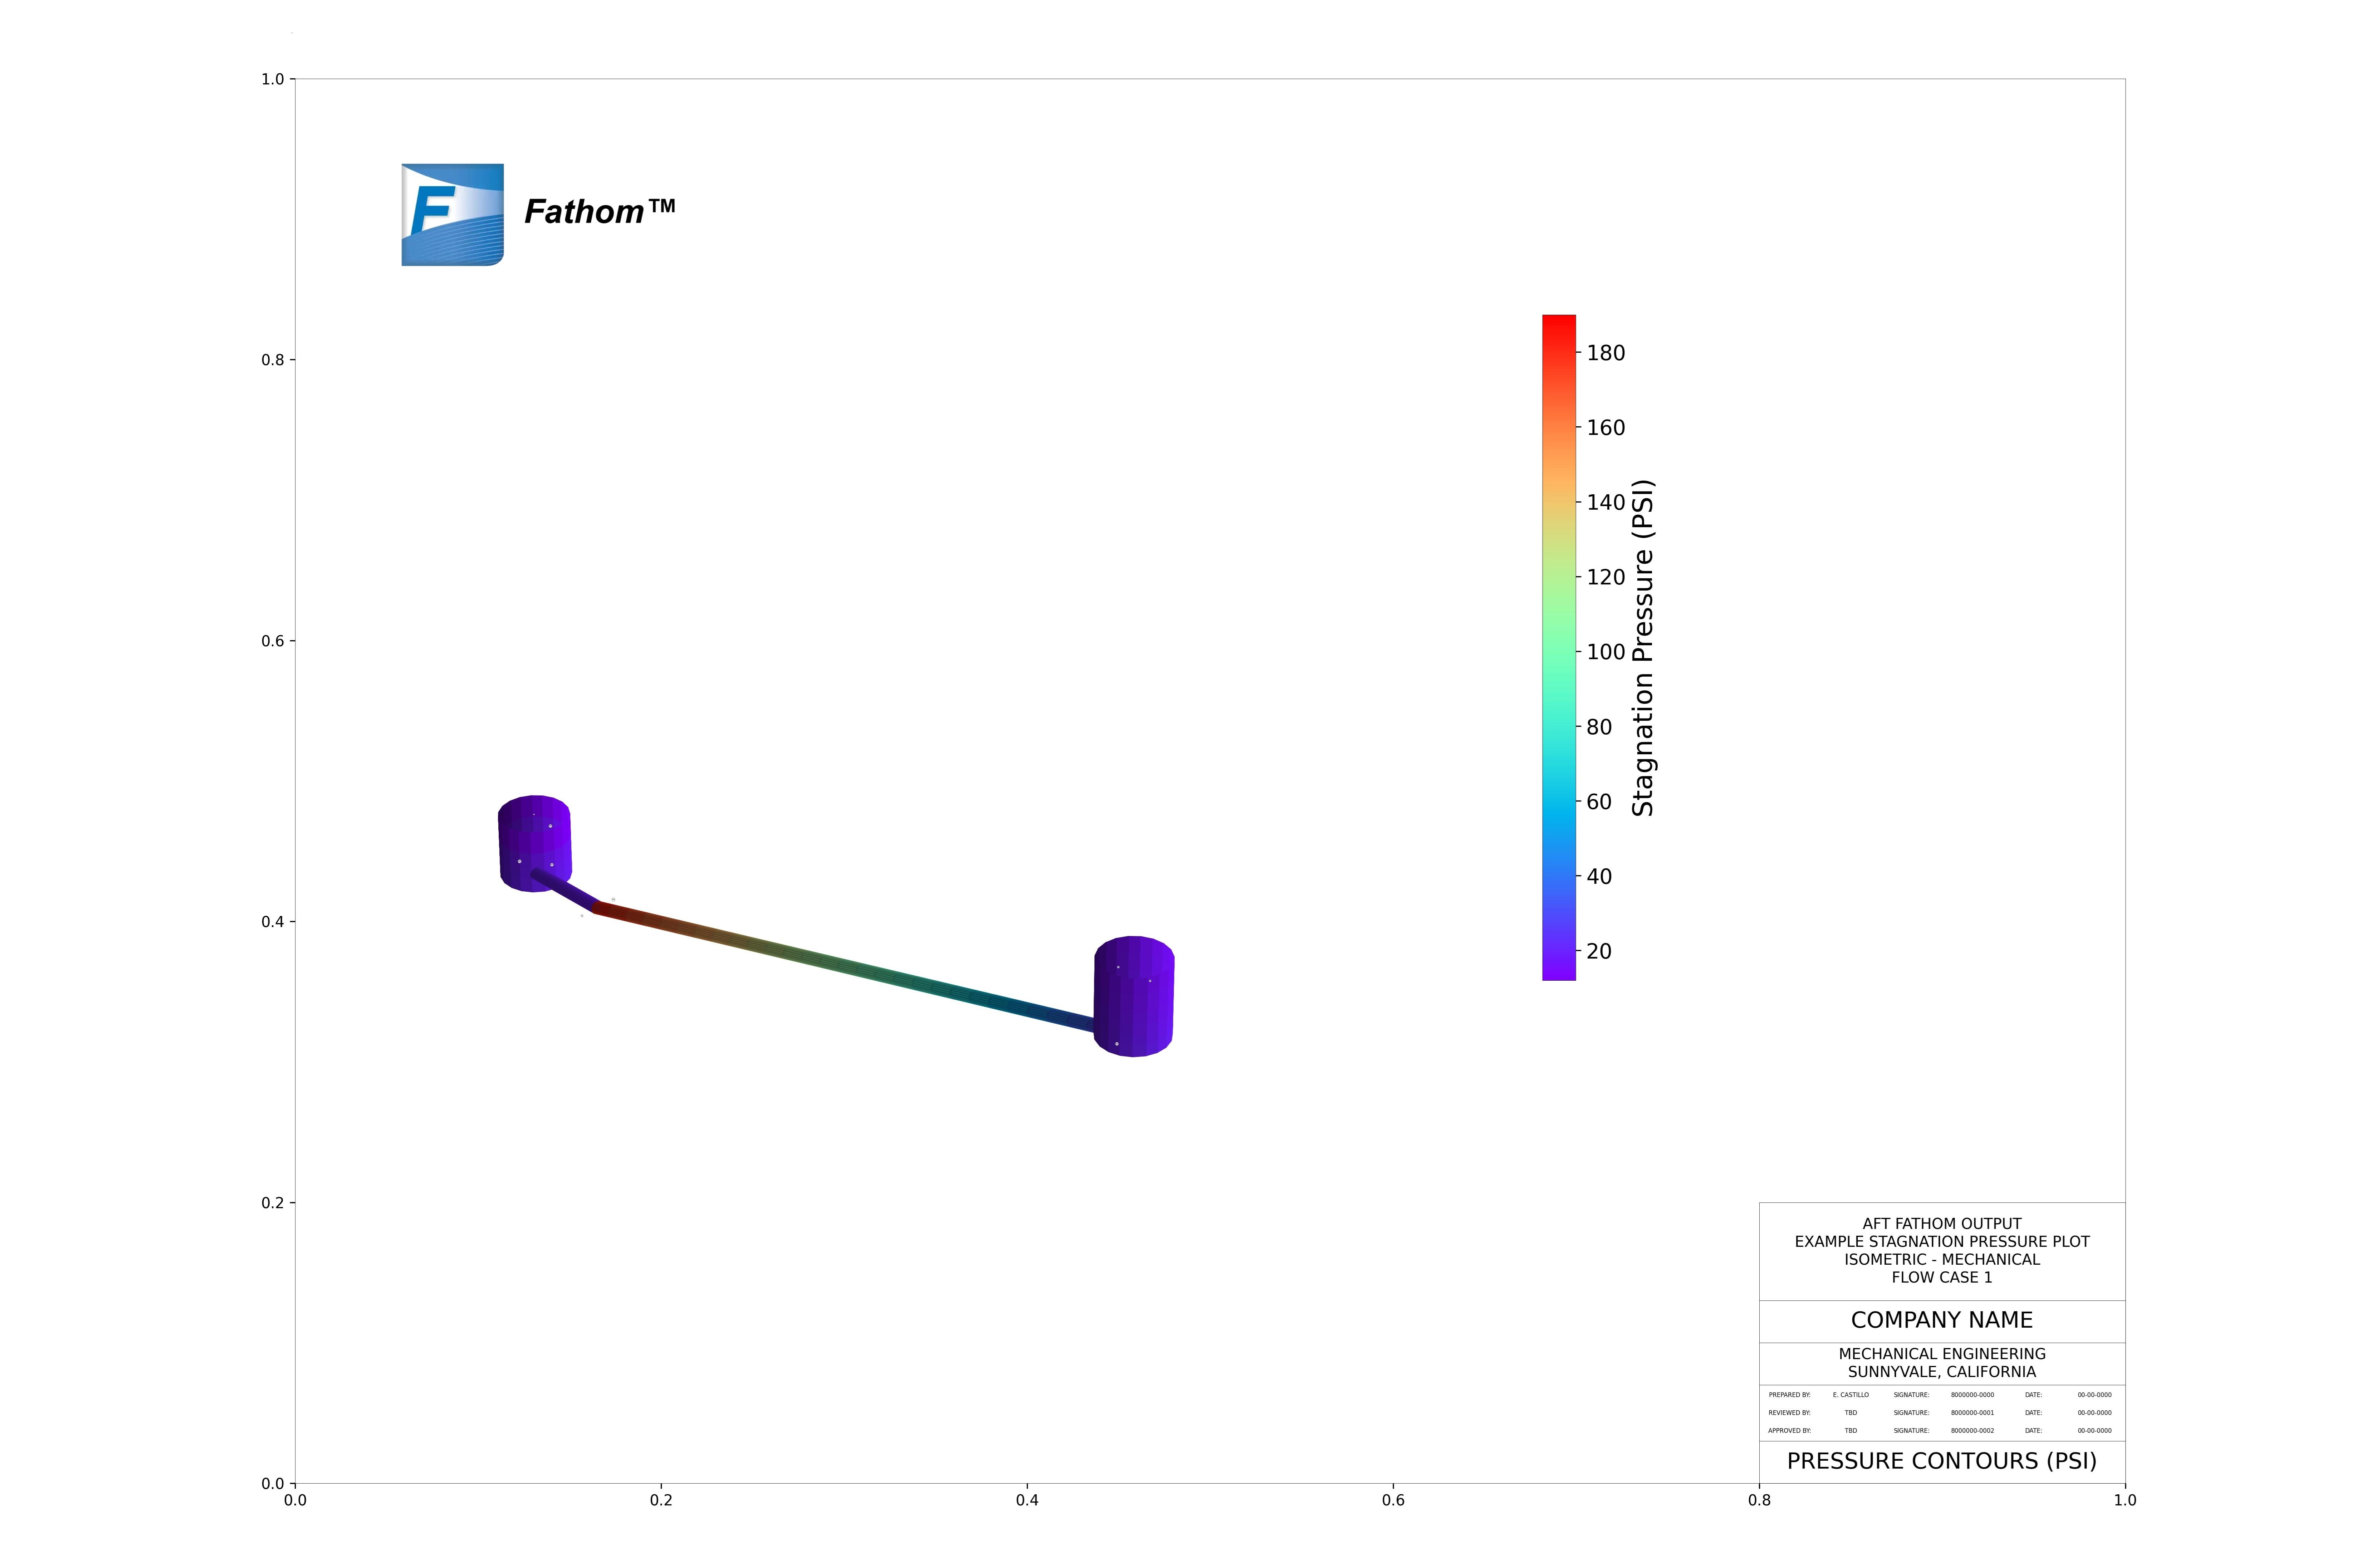
Below is a reproduction of the stagnation pressure results from the AFT Fathom model creation tutorial on YouTube, and a corresponding AutoPIPE pipe stress visualization.Both of these were generated automatically by NDAS.

By using NDAS, the range of pressures in a line can be approximated visually.
While the pressure downstream the pump (AFT Fathom model creation tutorial) drops from about 182 PSI to less than 20 PSI at the tank entrance, the entire line is labeled by Fathom as experiencing >160 PSIA maximum static pressure.
Using NDAS, a more detailed and granular approximation of the stagnation pressure throughout the pipe is produced, showing pressures between about 180 PSI (pump discharge) and 20 PSI (bottom of the tank). This higher level of detail can be especially useful when validating that enough pressure is available at a boundary, or understanding where significant pressure drops are taking place.
The NDAS Fully-Autonomous Drafting module leverages low-level vector calculus to develop high-fidelity three-dimensional system vizualizations.